Introduction
Notes
1. Describing Data: Graphically & Numerically
1.1 Constructing & Interpreting Graphs
1.2 Summarizing Distributions of Univariate Data
2. Correlation & Regression
2.1 Correlation & Regression
2.2 Regression, Part II
3. Surveys & Experiments
3.1 Planning & Conducting Surveys
3.2 Planning & Conducting Experiments
4. Probability & Expected Value
4.1 Probability Overview
4.2 Intro to Probability for Discrete Random Variables
4.3 Discrete Random Variables
4.4 Combining Independent Random Variables
4.5 Normal Random Variables
5. Distribution of Data
5.1 Sampling Distributions
6.Statistical Inference
6.1 Confidence Intervals
6.2 Hypothesis Testing
6.3 The T Distribution
6.4 Two Samples
6.5 Hypothesis Testing of Least-Squares Regression Line
6.6 Hypothesis Tests for Categorical Data (Chi-Squared Test)
Conditions And Assumptions
Problem Set
Sample Questions
Practice Exam Multiple Choice
2002 Multiple Choice
2011 Free Response Form B
2011 Free Response
2012 Free Response
2012 Multiple Choice
2013 Free Response
2014 Free Response
2014 Multiple Choice
2015 Free Response
2015 Multiple Choice
2016 Free Response
Princeton 1 Multiple Choice
Princeton 2 Multiple Choice
Published with GitBook
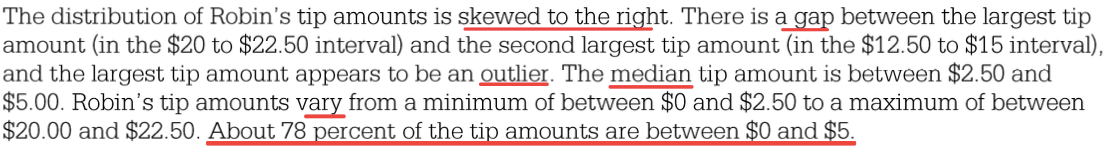
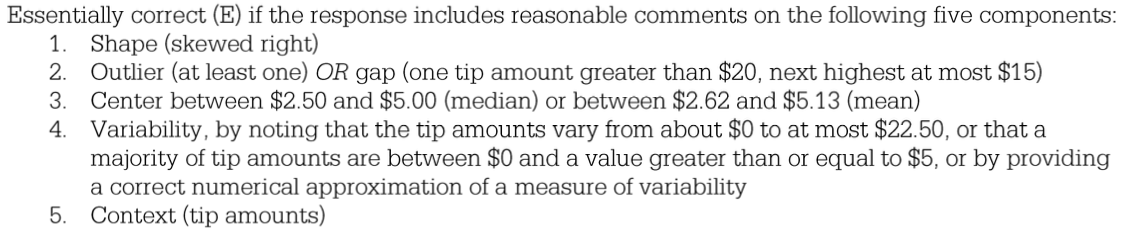
2016 Free Response
Question 1 (a)
Question 2 (a)
Question 3 (a)
Question 3 (b)
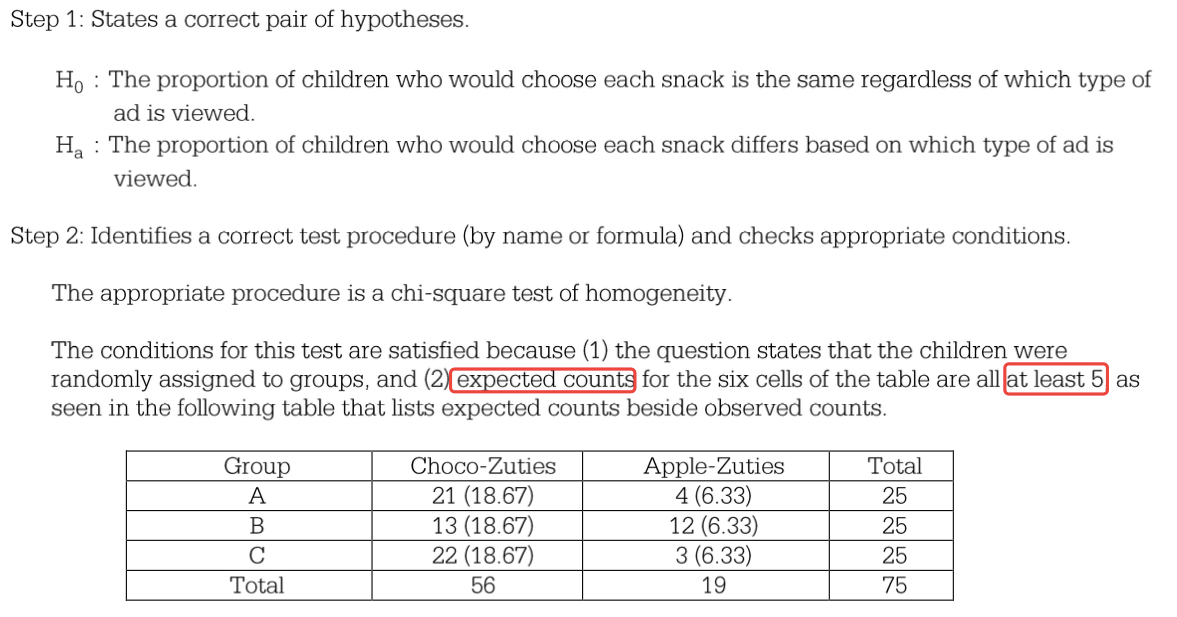
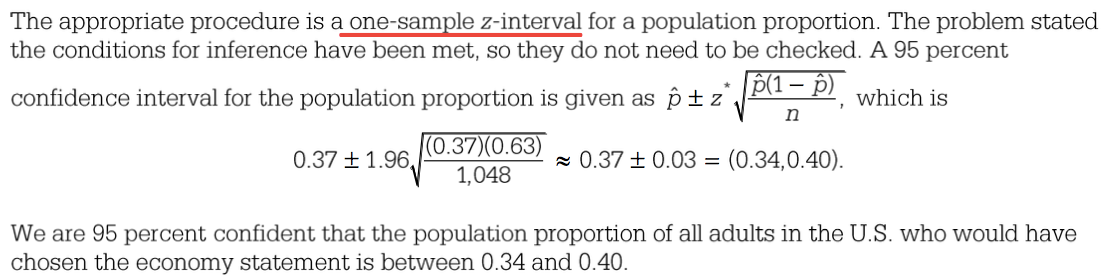
Question 5 (a)
Denote the procedure used
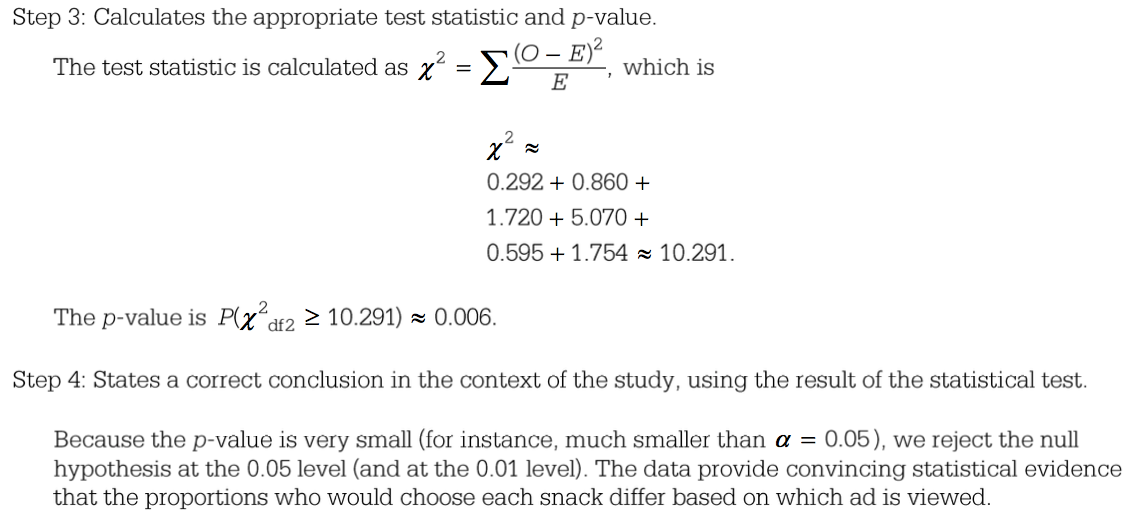
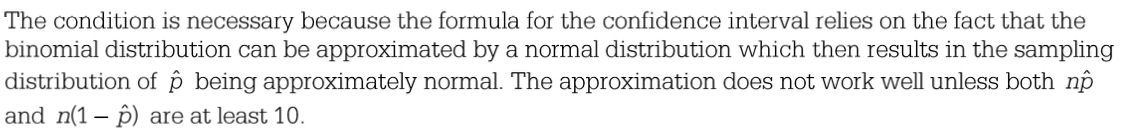
Question 5 (b)
Question 5 (c)
results matching "
"
No results matching "
"